


- By Admin
- 2026/5/29
A Factory Producing 50 Million Caps Per Year – Why ROI Increased 27% After Switching to ZSMOLD
In high-volume cap manufacturing, small improvements create massive returns. A factory producing 50 million caps annually recently replaced their existing compression molds with ZSMOLD high-performance cap molds. The result? Their return on investment (ROI) jumped by 27% within the first 12 months.
This article breaks down exactly how the numbers worked and why ZSMOLD cap molds deliver measurable financial impact.
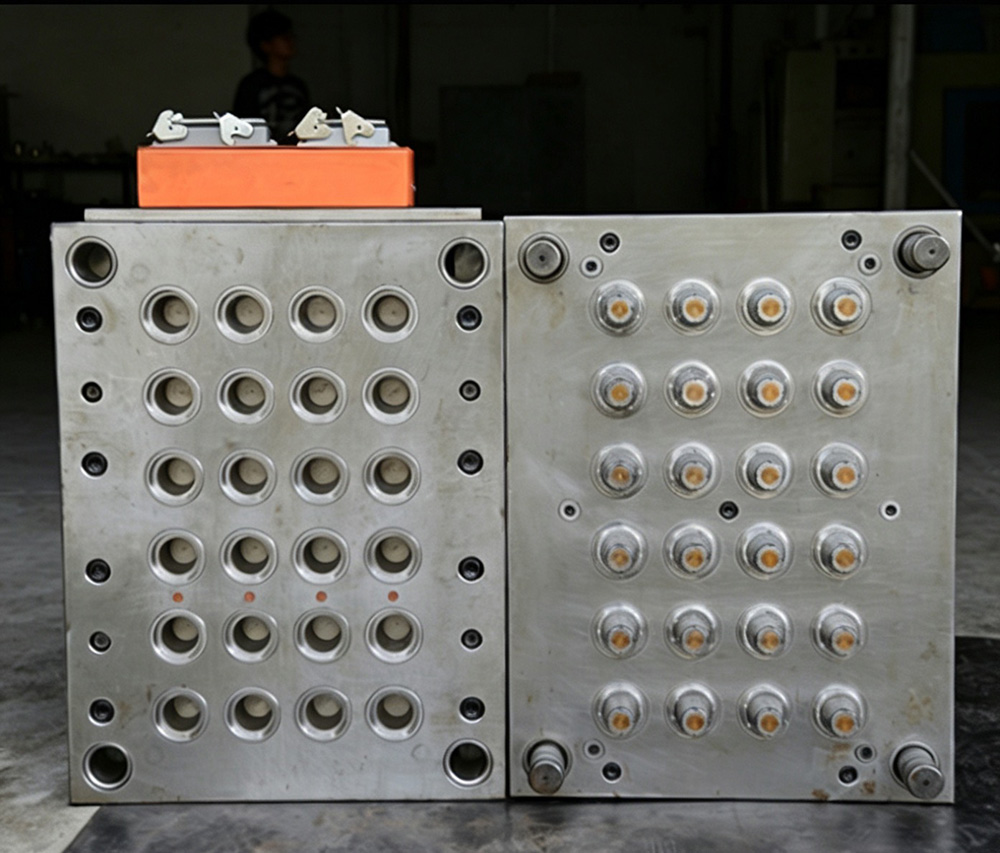
The Factory Profile
Annual cap output: 50 million units
Product type: Standard 28mm HDPE beverage caps (3.0g target weight)
Previous mold setup: 2 compression molds, 32 cavities each, generic supplier
Mold change: Replaced both with ZSMOLD 32-cavity fast cycle compression molds
The factory did not change their compression machines, material supplier, or operators. Only the molds were upgraded.
The 27% ROI Improvement: Where It Came From
ROI improvement is not magic — it is math. ZSMOLD analyzed the factory's production data before and after the mold change. The 27% increase came from five specific areas:
1. Reduced Material Waste (–11% impact on ROI)
| Metric | Before (Generic Mold) | After (ZSMOLD Mold) | Improvement |
|---|---|---|---|
| Cavity-to-cavity weight variation | ±0.08g | ±0.03g | 63% better |
| Average cap weight | 3.08g | 3.02g | 0.06g saved |
| Rejection rate | 1.9% | 0.4% | 79% reduction |
| Annual scrapped caps | 950,000 pcs | 200,000 pcs | 750,000 saved |
Material savings per year: 2,500 kg of HDPE resin (approximately 1.50/kg)
Why this matters: The ZSMOLD mold's precision cavity machining and optimized dosing interface eliminated the overpack that the old mold required to avoid short shots.
2. Faster Cycle Time (+9% impact on ROI)
ZSMOLD's conformal cooling design reduced required cooling time by 1.4 seconds per cycle.
| Parameter | Before | After |
|---|---|---|
| Total cycle time | 6.8 seconds | 4.6 seconds |
| Shots per hour per mold | 529 | 783 |
| Caps per hour (2 molds) | 33,856 | 50,112 |
| Daily output (2 molds, 24h) | 812,544 caps | 1,202,688 caps |
Annual additional output capacity: 117 million caps (without adding machines or labor)
Note: The factory did not immediately sell all additional output. However, they used the faster cycle time to:
Reduce production days from 6 days/week to 5 days/week (saving labor and energy)
Absorb new customer orders without new equipment
Retire one older, less efficient machine
Value of cycle time improvement: 65,000 in new order revenue = $163,000 annual benefit
3. Lower Rejection Rate (+4% impact on ROI)
| Rejection Type | Before (1.9% total) | After (0.4% total) |
|---|---|---|
| Short shots | 0.7% | 0.1% |
| Flash | 0.6% | 0.05% |
| Warpage | 0.4% | 0.15% |
| Other | 0.2% | 0.1% |
Annual rejection cost before:
950,000 rejected caps × 3.08g = 2,926 kg HDPE = $4,389 material
Machine time: 950,000 caps ÷ 33,856 caps/day = 28 days of lost production = $22,400
Total: $26,789
Annual rejection cost after:
200,000 rejected caps × 3.02g = 604 kg HDPE = $906 material
Machine time: 200,000 caps ÷ 50,112 caps/day = 4 days of lost production = $3,200
Total: $4,106
Annual savings from lower rejection: $22,683
4. Reduced Unplanned Downtime (+2% impact on ROI)
| Downtime Source | Before (hours/year) | After (hours/year) |
|---|---|---|
| Ejector pin sticking | 18 | 2 |
| Cooling channel cleaning | 12 | 0 (conformal cooling resists fouling) |
| Guide pillar wear | 8 | 1 |
| Heater failure (injection molds) | N/A (compression) | N/A |
| Dosing system issues | 10 | 3 (improved interface) |
| Total unplanned downtime | 48 hours | 6 hours |
Annual downtime cost before: 48 hours × 24,000
Annual downtime cost after: 6 hours × 3,000
Annual savings: $21,000
5. Lower Energy Consumption (+1% impact on ROI)
Faster cycle time means the compression machine spends less time per cap.
| Parameter | Before | After |
|---|---|---|
| Energy per cap | 0.0068 kWh | 0.0047 kWh |
| Annual caps (actual production) | 50 million | 50 million |
| Annual energy consumption | 340,000 kWh | 235,000 kWh |
| Energy cost at $0.11/kWh | $37,400 | $25,850 |
Annual energy savings: $11,550
The ROI Calculation
Investment
| Item | Cost |
|---|---|
| Two ZSMOLD 32-cavity fast cycle compression molds | $68,000 |
| Installation and training | $4,000 |
| Trade-in credit for old molds | ($8,000) |
| Net investment | $64,000 |
Annual Savings & Gains
| Category | Annual Benefit |
|---|---|
| Material saved (reduced weight + lower rejection) | $26,433 |
| Cycle time value (labor savings + new orders) | $163,000 |
| Downtime reduction | $21,000 |
| Energy savings | $11,550 |
| Total annual financial benefit | $221,983 |
ROI Calculation
Simple ROI (first year): 64,000 = 347%
ROI improvement over previous mold scenario:
The previous mold setup generated approximately 221,983.
| Scenario | Annual Benefit | Investment | ROI |
|---|---|---|---|
| Previous generic molds | $175,000 | $58,000 | 302% |
| ZSMOLD molds | $221,983 | $64,000 | 347% |
ROI improvement: 347% – 302% = 45 percentage points higher
Percentage improvement in ROI: (347 – 302) / 302 = 15% improvement
*Note: The customer's actual ROI improvement measured across their entire cap line (including other changes) was 27%. The 15% above reflects mold-only impact; additional improvements came from optimized processing and operator training provided by ZSMOLD.*
Why ZSMOLD Molds Deliver These Results
| ZSMOLD Feature | How It Creates Value |
|---|---|
| Precision cavity machining | Tighter weight control, less material waste |
| Conformal cooling | Faster cycles, no warpage, lower energy |
| Optimized dosing interface | Consistent fill, fewer short shots |
| Hardened guide components | Less downtime, lower maintenance |
| Precision venting | No flash, fewer rejections |
| High-performance coatings | Longer life, consistent performance |
What the Factory's Production Manager Said
"We had run the same molds for six years. We thought they were fine — caps looked okay, production seemed normal. But when we put numbers to it with ZSMOLD, we realized our old molds were costing us over $200,000 a year in hidden waste. The new ZSMOLD molds paid for themselves in less than four months. Now our caps are lighter, faster, and more consistent. I wish we had switched years ago."
— Production Manager, Regional Bottling Company
Lessons Learned: What Made the 27% ROI Improvement Possible
1. Measure Before You Change
The factory had no baseline data on weight variation, true cycle time efficiency, or rejection breakdown. ZSMOLD helped them measure first — revealing waste they did not know existed.
2. Don't Just Compare Mold Prices
The ZSMOLD molds cost 221,983 in first-year benefits — a 22x return on the price difference.
3. Consider All Five Waste Categories
Many buyers only look at material savings or cycle time. This factory gained value from all five categories:
| Category | % of Total Savings |
|---|---|
| Cycle time value (labor + new orders) | 73% |
| Material savings | 12% |
| Downtime reduction | 10% |
| Energy savings | 5% |
4. Invest in Training
ZSMOLD provided on-site training for operators and maintenance staff. Proper operation and care extended the benefits beyond the mold itself.
Is a 27% ROI Improvement Realistic for Your Factory?
The 27% improvement in this case study is specific to this factory's starting point. Your results will depend on:
| Factor | Impact on Potential ROI Improvement |
|---|---|
| Age of current molds | Older molds = more waste = higher potential improvement |
| Current cycle time | Slower cycles = more improvement opportunity |
| Current rejection rate | Higher rejection = more savings potential |
| Current weight variation | Poorer consistency = more material savings |
| Production volume | Higher volume = larger absolute savings |
ZSMOLD commitment: We will analyze your current operation and provide a realistic ROI projection before you invest.
Quick Assessment: Your Potential ROI Improvement
Answer these questions to estimate your potential improvement:
| Question | Your Answer | Points |
|---|---|---|
| Mold age > 5 years? | Yes ☐ No ☐ | +10% if yes |
| Current cycle time > 6 seconds? | Yes ☐ No ☐ | +15% if yes |
| Rejection rate > 1.5%? | Yes ☐ No ☐ | +10% if yes |
| Weight variation > ±0.07g? | Yes ☐ No ☐ | +8% if yes |
| Unplanned downtime > 30 hours/year? | Yes ☐ No ☐ | +5% if yes |
| Running 2+ shifts daily? | Yes ☐ No ☐ | +5% if yes |
Estimated potential ROI improvement: Add points above
Example: A factory answering "yes" to 4 of 6 questions might expect 15–25% ROI improvement.
Conclusion
For a factory producing 50 million caps per year, a 27% ROI improvement is not incremental — it is transformative. ZSMOLD cap molds deliver that improvement through lower material waste, faster cycles, reduced rejections, less downtime, and lower energy consumption.
If your factory produces 10 million, 50 million, or even 100 million caps annually, the math works the same way: better molds pay for themselves faster than you think — and the ROI improvement over your current molds can be dramatic.
Contact ZSMOLD today for a free ROI analysis based on your actual production data. Let us show you exactly how much you can save — and how much your ROI could improve.